

If you are studying product analytics tools, then you’ve probably come across Amplitude. It’s one of the most well-known names in the space, used by product teams at companies like Atlassian, Under Armour, and Shopify to understand how people actually use their digital products. It crops up everywhere in the “best analytics tools” rounds, and for good reason, it was one of the first platforms to push event-based product analytics and not just web analytics.
But popularity isn’t a sign of fit. Amplitude is an extremely powerful, often complicated tool, and if it works for your team, it will depend on your use case and data maturity, as well as on budget. We explain what Amplitude is and how it works, its core features, pricing structure, and pros and cons, and how it competes with GA4 and others so you can make an informed decision.
Amplitude at a Glance
| Category | Digital product analytics platform |
| Best for | Product managers, growth teams, data analysts |
| Core strength | Event-based behavioral analytics (funnels, retention, cohorts) |
| Key features | Event tracking, dashboards, funnel/retention analysis, cohorts, session replay, experimentation, CDP |
| Pricing model | Based on monthly tracked users (MTUs) |
| Free plan | Yes, with a free trial available for paid tiers |
| Paid plans | Plus, Growth, Enterprise (custom pricing) |
| Main competitors | Mixpanel, Heap, PostHog, Google Analytics 4 |
| Learning curve | Moderate to steep |
| Ideal team size | Startups to enterprise (pricing scales with usage) |
What Is Amplitude?
Amplitude is a digital product analytics platform for helping teams understand user behavior in their apps and websites. Instead of just monitoring page views in the same way as traditional web analytics tools, This is focuses on events, specific actions users engage in (“signed up” or “added item to cart” or “completed onboarding”). This event-based approach is especially attractive to product managers, growth teams, and data analysts who must answer the questions “which features drive retention?” and “where do users drop off in this flow?”
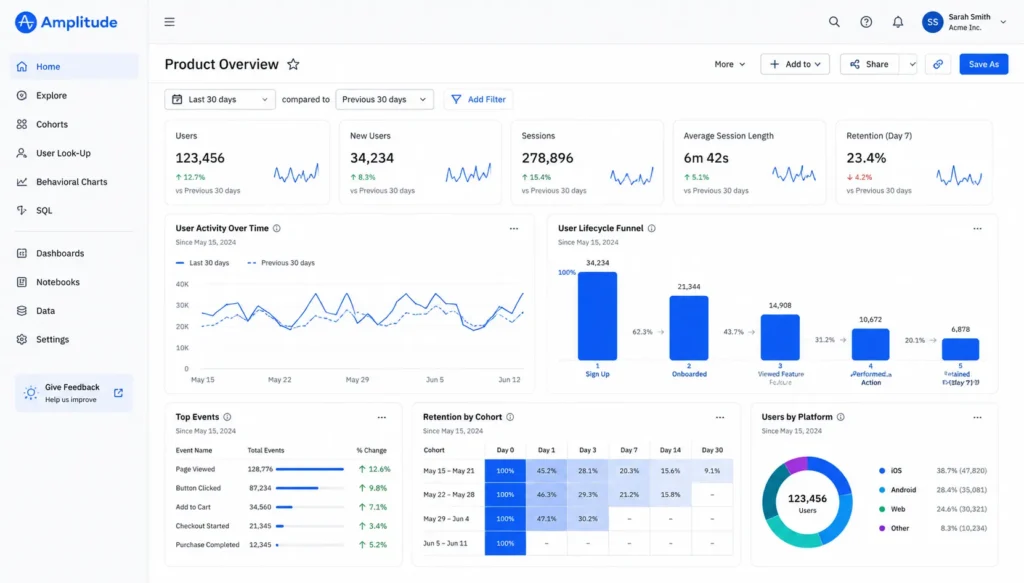
Amplitude started out as a mobile analytics tool in 2012 and has grown into a full analytics platform that includes experimentation and session replay as well as CDP (customer data platform) capabilities. It went public in 2021 and now it is less a single analytics tool and more a “digital analytics platform” that is designed to be at the center of a company’s product decision-making process and product development.

The main idea behind Amplitude is simple: page views and sessions tell you that someone visited your product, but they don’t tell you what they did or whether it mattered. Amplitude’s event model captures the specific actions users take, along with contextual properties of those actions, so teams can move from “how many people visited” to “how many people actually got value.”
Who Uses Amplitude?
Amplitude is generally aimed at three overlapping groups:
- Product managers who need to know feature adoption, drop-off points, and which aspects of the product actually drive retention.
- Growth and marketing teams who want to connect acquisition channels to downstream behavior, not just signups, but activation and long-term engagement.
- Data analysts and data teams who want a self-service tool that reduces the number of one-off SQL queries and ad hoc reporting requests from other departments.
Because of this focus, This is better suited to SaaS products, mobile apps and consumer platforms wherein in-product behavior is the main driver of revenue rather than content sites or businesses that are primarily concerned with marketing attribution.
Key Amplitude Features
Event Tracking
At its heart, Amplitude event tracking allows you to keep track of any user action and attach properties to it (device, location, plan type, referral source, etc.). The granular data powering most of the platform’s advanced analysis tools is based on this data set. To do this in Amplitude, we need to define a taxonomy of events in advance to get things tracked up and running (a naming convention and structure for what should be tracked) which is one of the most laborious and time-consuming parts of starting with Amplitude.
Amplitude Dashboard and Visualizations
The Amplitude dashboard is where teams build and monitor charts, funnels, and retention curves. You can create custom dashboards for different teams, marketing, product, and engineering and share live views without needing anyone to touch raw data or SQL. Dashboards can be pinned and annotated with notes about releases or experiments and set up to refresh automatically, which is useful for weekly business reviews or standups.
Funnel and Retention Analysis
Amplitude’s funnel analysis shows where users drop off in a multi-step process (from signup to first purchase), while retention charts (including cohort-based retention) help teams know if the product is indeed sticky over time. You can slice funnels and retention curves by any user property or event property, which makes it easy to see, say, that mobile users drop off at a different step than desktop users.
User and Behavioral Cohorts
You can segment users into cohorts based on behavior, for example “users who completed onboarding but never invited a teammate”, and monitor how those cohorts behave differently. Cohorts can also be pushed into other tools (e.g., email marketing platforms) to campaign specifically for them, which is a very common use case for growth teams who want to re-engage certain user segments.
Session Replay
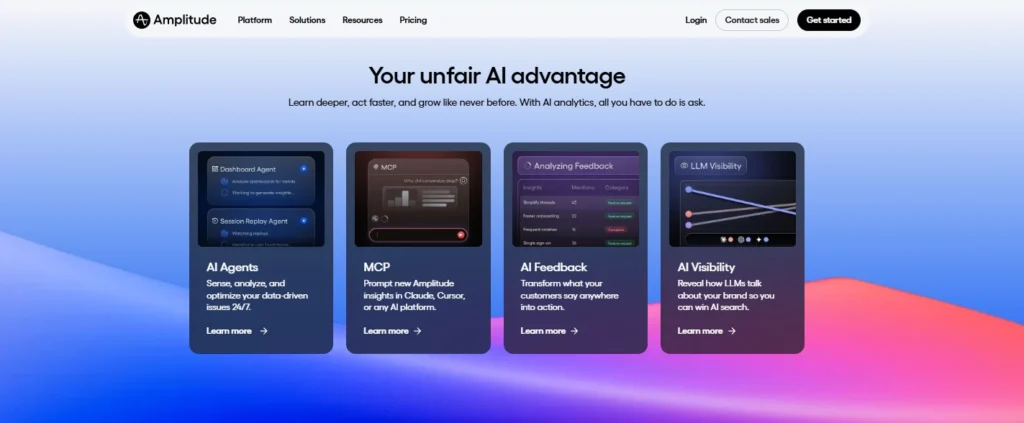
Amplitude provides session replay functionality, allowing teams to watch anonymized recordings of real user sessions to spot friction points that numbers alone don’t reveal. This is particularly useful for UX research and debugging; pairing a funnel drop-off with an actual recording of a user hitting that exact wall can shortcut a lot of guesswork.
Experimentation
Amplitude Experiment is a built-in A/B testing and feature-flagging tool so that teams can do experiments and analyze the results without having to build a separate testing platform. This close integration between experimentation and analytics is one of Amplitude’s key strengths— you can run a test, track its performance against real behavioral metrics and then integrate that into a more comprehensive retention analysis all in the same system.
Amplitude Data / CDP Capabilities
Amplitude also provides data governance and pipeline tools so teams can standardize event taxonomies and pipe clean data into warehouses and other tools. In this way, the “Amplitude Data” layer is aimed at larger organizations that need to enforce consistency across multiple teams shipping events and to avoid the common problem of duplicate or poorly named events cluttering the platform over time.
Integrations
Amplitude connects with a wide variety of tools, ranging from data warehouses (Snowflake, BigQuery, and Redshift) to CRMs, marketing platforms, and customer data platforms. It also supports SDKs on the web, iOS, Android, and server sides and thus is compatible with any modern tech stack with no need for extensive custom design.
Amplitude Pricing and Plans
Amplitude’s pricing has changed over the years, and it’s worth checking Amplitude’s official pricing page for the latest numbers, but broadly the plans break down like this:
| Plan | Best For | Pricing Basis | Price (Approx.) |
| Starter (Free) | Early-stage startups, solo builders | Free (usage capped at monthly tracked users/events) | $0/month |
| Plus | Growing teams needing more depth | Usage-based (MTUs / events) | From ~$17–$25/month (entry-level), scales with usage |
| Growth | Mid-size to larger teams | Usage-based (MTUs / events) | ~$20/month base (small usage) → ~$2,500+/month at scale (~10M events) |
| Enterprise | Large organizations | Custom contract | Custom pricing (typically $25K+/year and above; varies widely) |
Exact dollar figures and MTU thresholds are not listed here since Amplitude updates them periodically; confirm current numbers on Amplitude’s pricing page or with their sales team before budgeting.
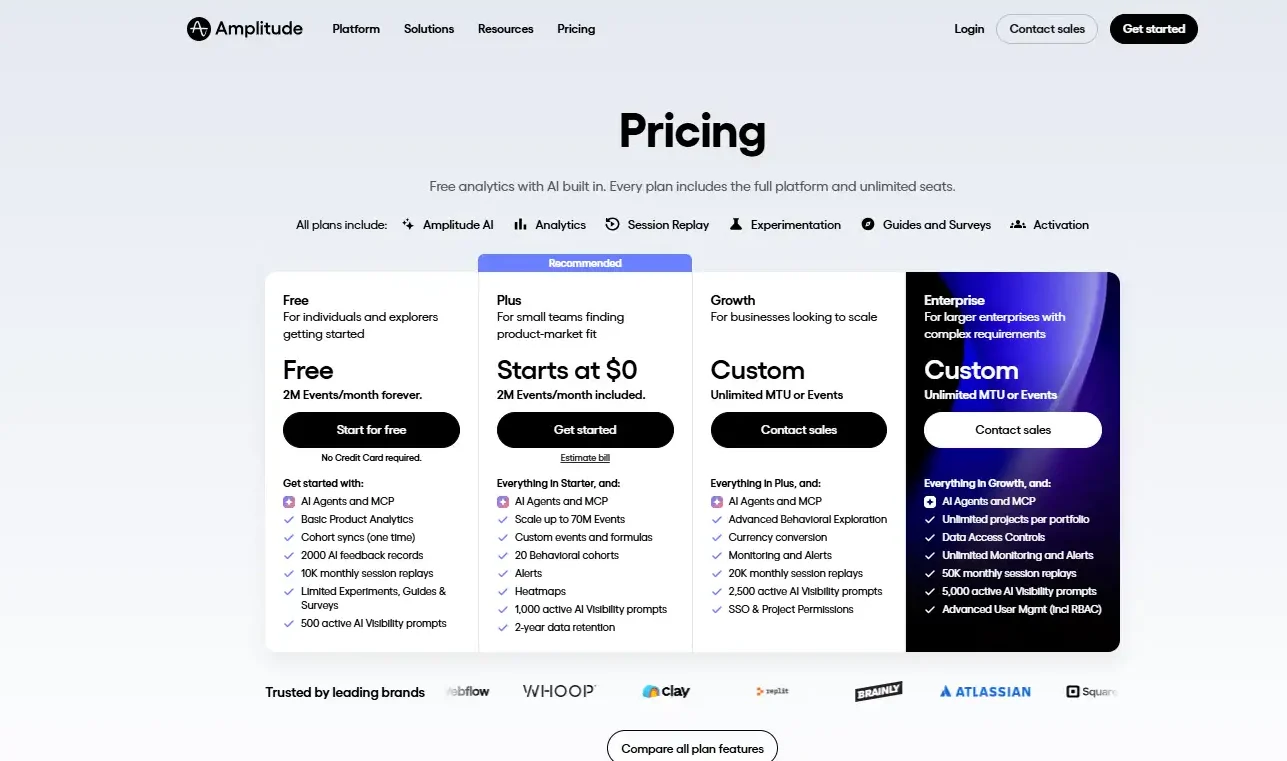
Starter (Free plan): Amplitude offers a free trial and free tier for small teams and early-stage startups with a monthly tracked-users cap and access to core analytics features. This is often enough for early-stage products to show some real value before paying anything.
Plus: Paid mid-tier plan for larger teams who need more integrations, more data limits, and more charts.
Growth: For larger teams that require more advanced governance, collaboration, and support with higher usage ceilings.
Enterprise: custom pricing for large organizations with advanced security, SSO, dedicated support, higher volumes, and full experimentation and CDP suites.
We do not provide exact dollar figures and MTU thresholds here as Amplitude updates them quarterly, although we confirm current numbers on Amplitude’s pricing page or with their sales team before budgeting. Because Amplitude prices are largely based on monthly MTUs (MTUs), not seats, costs will increase as a function of product growth and not headcount. This is something to plan for: a viral uptick in signups or a successful marketing campaign will push you to a higher pricing tier even if your team size hasn’t changed. If cost predictability is important, if you are going to make your MTU volume a priority, run that up to their sales team before you commit and ask how overages are handled.
Getting Started: What Implementation Actually Looks Like
One thing that doesn’t always come through in feature lists is how much upfront work Amplitude has to do before it can go live. Amplitude’s traditional model is not one that takes every click for granted, and so it requires someone on your team, usually an engineer working with product, to:
- Define which events matter (signup, purchase, key feature usage, etc.).
- Agree on a consistent naming convention throughout the whole organization.
- Implement tracking calls in the codebase or through a tag manager.
- Validate that events are firing correctly with accurate properties.
- Maintain that taxonomy as the product develops.
Skipping or rushing this process is the most common reason teams end up disappointed with any product analytics tool, not just Amplitude. The payoff, clean, trustworthy behavioral data, is real, but it isn’t instant.
Amplitude Pros
- Best behavioral analytics. Very few tools are as deep as Amplitude in funnels, retention, and cohort analysis.
- Strong self-serve exploration. The non-technical team can create their own charts without needing a professional analyst to answer every question.
- All-in-one suite. Bundling experimentation, session replay, and CDP features reduces the need for extra tools and reduces integration overhead.
- Scales with data complexity. Handles high event volumes and complex user properties well, which matters for large consumer products.
- Generous free tier for teams just starting product analytics, making it realistic to test before committing budget.
- Mature integration ecosystem, so it tends to fit into existing data stacks without major rework.
Amplitude Cons
- Steep learning curve. New users often need time (and sometimes help onboarding) to set up event taxonomies and get value from the platform.
- Pricing can rise quickly. MTU-based pricing means a viral growth spurt can also mean a pricing surprise, making budgeting difficult for fast-growing products.
- Overkill for simple needs. If you just need basic website traffic reporting, Amplitude is more tool than you need, and a simpler or free one will probably be more beneficial to you.
- Data implementation is on you. Quality of insights will depend on how well your team defines and instruments events; garbage in, garbage out, no matter how good the analysis layer can be.
- Governance overhead at scale. Larger organizations without a clear owner for the event taxonomy can get messy, duplicated, or inconsistent tracking over time.
Amplitude vs GA4
This is one of the most common comparisons people search for, so it’s worth addressing directly.
| Feature | Amplitude | GA4 |
| Focus | Product/behavioral analytics | Web/marketing traffic analytics |
| Best for | Product teams optimizing in-app behavior | Marketers tracking acquisition and traffic sources |
| Cost | Paid tiers scale with tracked users | Free, with a paid enterprise version (GA360) |
| Ease of use | Steeper learning curve | Easier for marketing-first use cases |
| Depth of behavioral analysis | Very strong (funnels, cohorts, retention) | More limited without heavy customization |
| Experimentation | Built in (Amplitude Experiment) | Requires separate tools (e.g., Google Optimize successor tools) |
| Session replay | Built in | Not included |
In short, GA4 is often the better starting point for marketing-driven traffic and acquisition analysis, while Amplitude is built for teams that need to deeply understand in-product behavior. Many companies actually use both: GA4 for top-of-funnel marketing data (where traffic comes from and campaign performance) and Amplitude for what happens after someone becomes a user (activation, retention, and feature adoption). They’re not competitors so much as tools that answer different halves of the same question.
Amplitude Alternatives
If Amplitude is not the right fit, some common alternatives are:
- Mixpanel is another event analytics platform and one that is much more accessible for smaller teams and a little less hard on the learning curve.
- Heap: automatic event capture, as it can reduce manual instrumentation, which can be appealing for teams that do not want to define a taxonomy immediately.
- PostHog: open-source; popular with engineering-heavy teams who want self-hosting and more control over their data infrastructure.
- Google Analytics 4 is best for marketing/traffic use cases rather than deep product analytics, free for most standard use cases.
The right choice has to do with team size, technical resources, and if your questions are about marketing performance or in-product behavior.
Is Amplitude Worth It?
Amplitude is a good choice if your team is interested in product usage, not just traffic, and has the tools for instrumenting and interpreting the data. It’s less of a fit if you need something lightweight, you’re mainly focused on marketing attribution rather than in-product behavior, or you don’t yet have anyone who can own event tracking and taxonomy over time.
If you are not sure, starting with Amplitude’s free plan or free trial is a good way to see how well the platform fits your workflow before committing to a paid tier. During this trial, pay attention to how much setup work is done and what you’re doing to make the team act on the information you get from the data, that’s usually a better sign of fit than the feature list alone.
Note: Pricing and plan structures for SaaS products like Amplitude change frequently. Always check the pricing and plan features on Amplitude’s official website before making a decision.
Frequently Asked Questions
Q. Is Amplitude free to use?
A. Yes, Amplitude has a free service with a monthly tracked-users cap and free trials for its paid tiers. It’s an efficient way to judge the platform before signing up for a paid model.
Q. Is Amplitude hard to learn?
A. It has a moderate to steep learning curve, particularly how to set up event tracking and taxonomies properly. Once the foundation is set up, the day-to-day dashboard and chart-building experience is fairly self-service.
Q. Do we really need Amplitude (versus Google Analytics)?
A. The aim of Amplitude is in-product behavior, while GA4 is web traffic and marketing attribution. While many teams use both for different purposes rather than just one or the other.
Q. Who should use Amplitude?
A. Product managers, growth teams, and data analysts at SaaS companies, mobile apps, and consumer platforms that need to understand feature usage, retention, and user journeys in depth.
Q. What type of businesses benefit most from Amplitude?
A. Amplitude is best suited for SaaS companies, mobile apps, eCommerce platforms, and digital products that need detailed insights into user behavior, feature adoption, and customer retention.
Q. Is Amplitude better than Mixpanel?
A. It depends on your needs. Amplitude offers powerful behavioral analytics, experimentation, and governance features, while Mixpanel is often preferred by smaller teams looking for a simpler analytics platform.